ERCOT Load Growth Analysis
Author: Jeff Thibodeau
In our examination of power demand within ERCOT for the summer of 2023, a notable increase in load was observed across nearly all regions. Records were set for absolute temperatures and for their persistence in many major cities. Houston saw its highest temperature ever recorded, while Austin and San Antonio recorded a whopping 45 and 17 consecutive days, respectively, above 105 degrees1. Record heat was certainly a culprit for load growth this summer, but to what extent?
Summary
The relationship of load to temperature is well-understood, but load in Texas continues to climb even during more regular or previously-observed temperature levels2. Increasing commercial and industrial activity and population growth are the main contributing factors, exacerbated by a lack of energy efficiency policy.
With the exception of Dallas, all regions display robust load growth from 2019 through 2023, with the Far West region demonstrating both the highest expansion and the lowest correlation to temperature. This aligns with the understanding that the Far West region houses a significant share of industrial users, including cryptocurrency mining facilities and data centers. These industrial entities have reduced sensitivity to ambient temperature fluctuations.
Findings
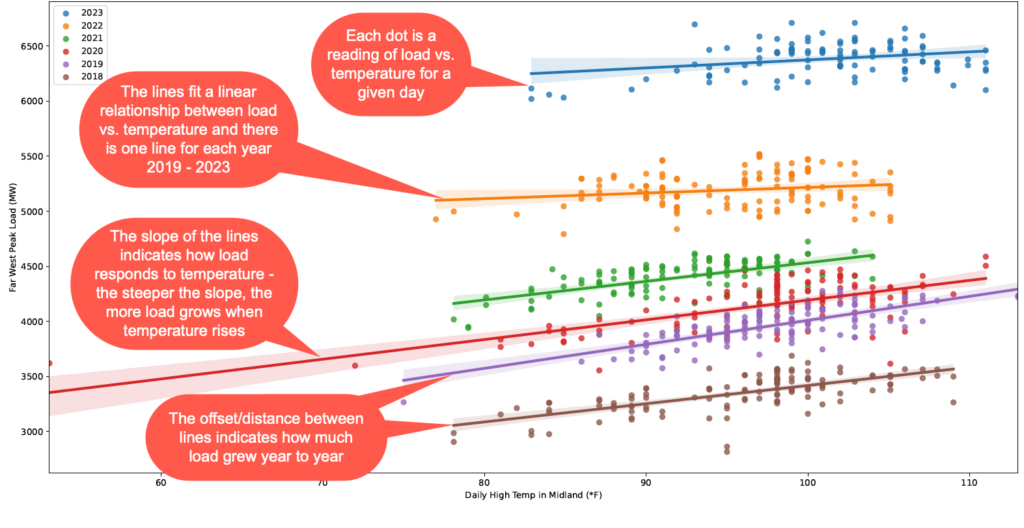
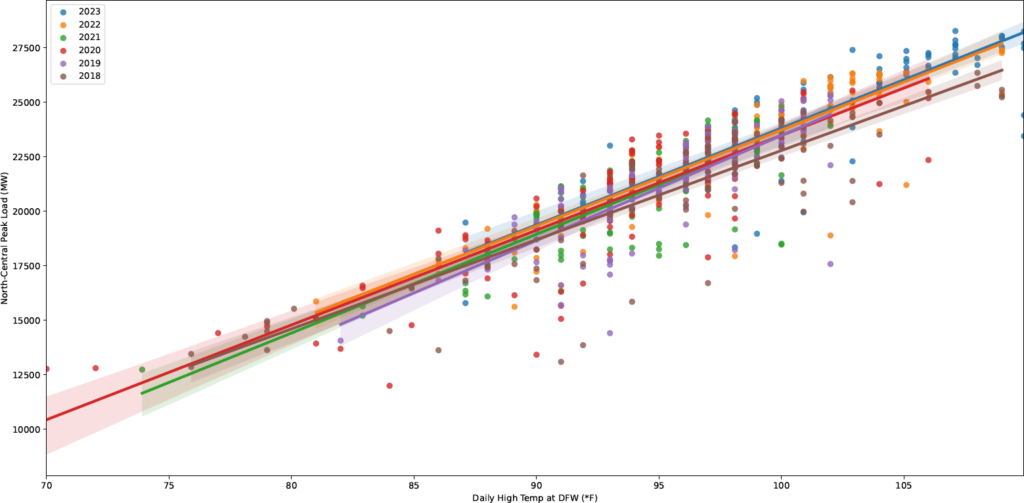
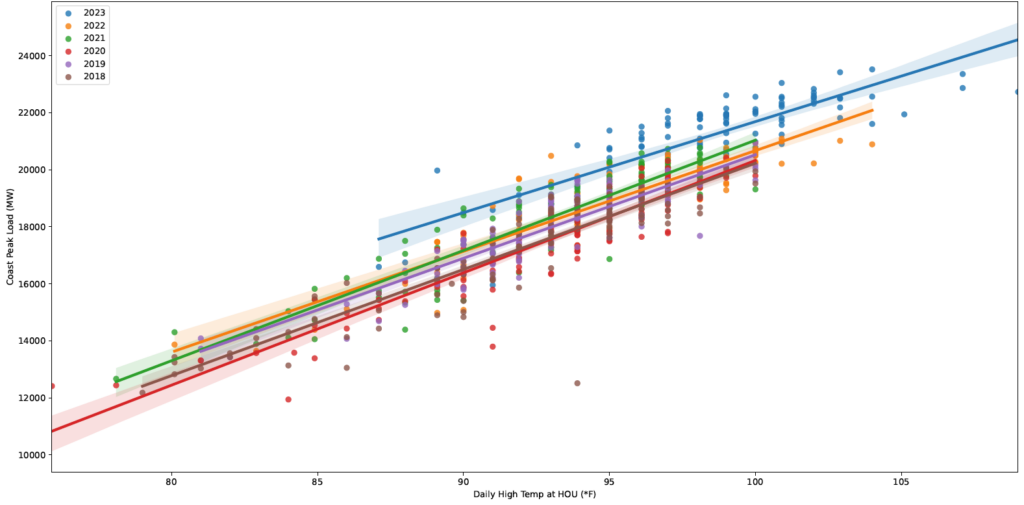
The following graphs illustrate weather zone load vs maximum daily temperatures from June through August observed at Dallas-Fort Worth, Austin & San Antonio, Houston, and the Far West regions of Texas.
How to read the graphs
Dallas-Forth Worth
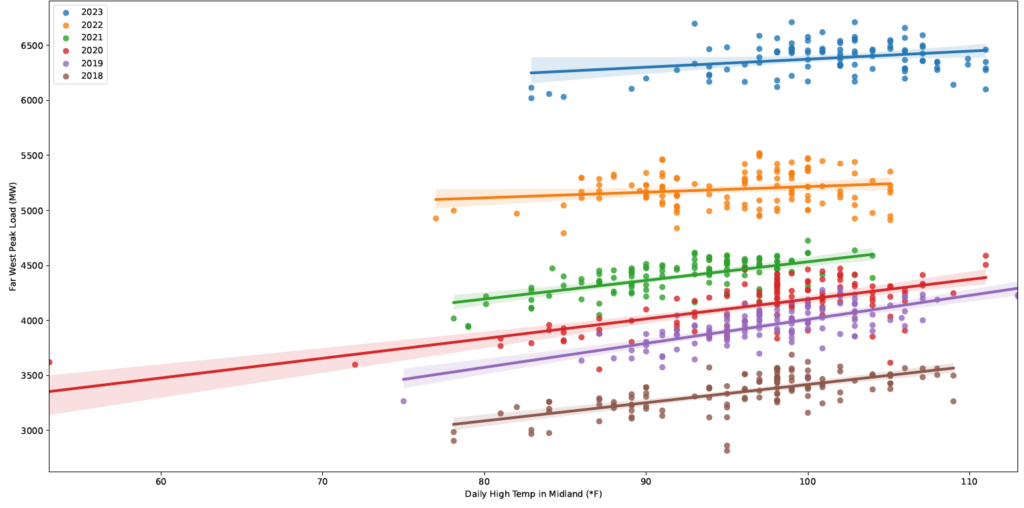
Far West
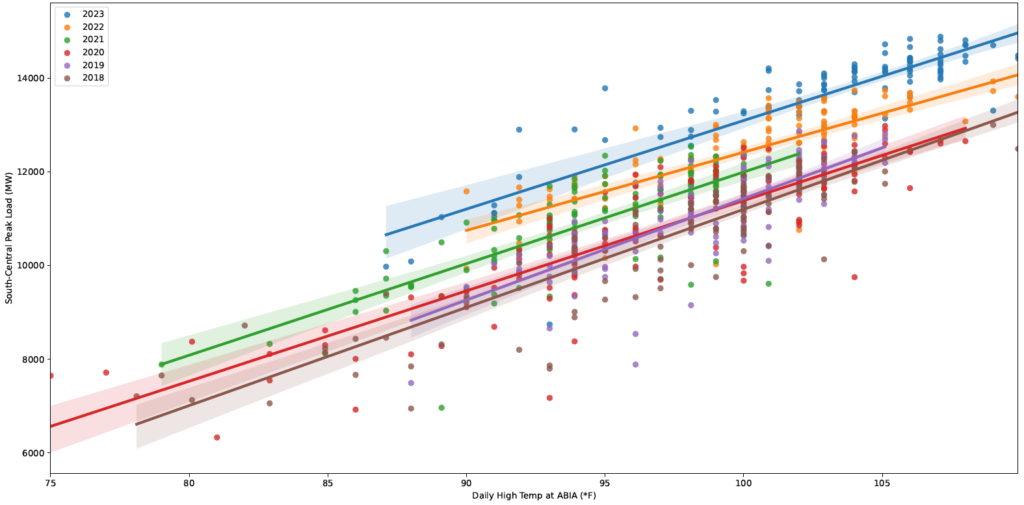
Austin & San Antonio
Houston
The data comprises actual observations recorded by the National Oceanic and Atmospheric Administration (NOAA) at the respective local airport observation centers during the period from June to September, 2018-2023.
In all regions except Dallas-Fort Worth, there is a discernible upward trend in load for the same temperature levels, as evidenced by the consistent year-to-year linear offsets.
The relatively flat slopes of the lines in the Far West region illustrate the substantial presence of industrial demand, driven by heavy oil and gas activities, as well as the concentration of data centers and cryptocurrency mining facilities. The strategic placement of these facilities in this region, owing to its high renewable energy penetration, results in demand patterns that are less responsive to temperature variations compared to regions characterized by a higher proportion of residential energy users.
Additionally, the Far West’s status as one of the smaller ERCOT weather zones amplifies the visibility of industrial growth, offering a clearer contrast to the larger regions within ERCOT. Data centers are not unique to Far West but are certainly the most discernible here in the total load numbers.
When looking at the Houston and Austin/San Antonio regions, however, we see significantly stronger slopes of load vs temperature (vs. Far West) due to the high amount of residential and commercial load. This temperature-sensitive load is also paired with industrial growth to continue the theme of increasingly offset load vs the prior year.
Conclusion
Texas’ population has been growing for at least the last two decades at 1 to 2% annually, most recently at 1.6% in 2022. The total state population now exceeds 30,000,000 people, second only to California.3 The rate of population change has been increasing again after 2020, and so have the temperatures.
ERCOT is lucky that its incomparable load growth is paired with strong growth in renewable capacity, from 26.7 GW in 2018 to 47.6 GW in 20234. Even so, Summer 2023 pushed the grid to the brink of blackouts. And from a climate perspective, these record-breaking renewable additions have only allowed emissions to stagnate, at a time when they need to be in freefall.
Unrelenting growth goes by another name in medical circles: cancer. For how long can the energy-rich state keep pace with this demand while ignoring energy efficiency?
1 Source: https://www.texastribune.org/2023/09/07/texas-hottest-summer-2023/
2 There are many other factors that impact load including dewpoint and duration of a heat pattern, but temperatures are the strongest drivers and are the main focus of this piece.
4 Source: ERCOT Resource Adequacy – https://www.ercot.com/files/docs/2023/09/19/SARA_Fall2023.xlsx